
The map
Every line a planning officer will look at.
The same government data your council consults, over any site in the United Kingdom, on a street basemap so the constraints read as data rather than as mud over a photograph.
- Layers wired to a live source
- 88Layers wired to a live source
- Groups they are organised into
- 14Groups they are organised into
- Basemaps to switch between
- 4Basemaps to switch between
- To use all of it, for ever
- £0To use all of it, for ever
Real capture
This is the actual product.
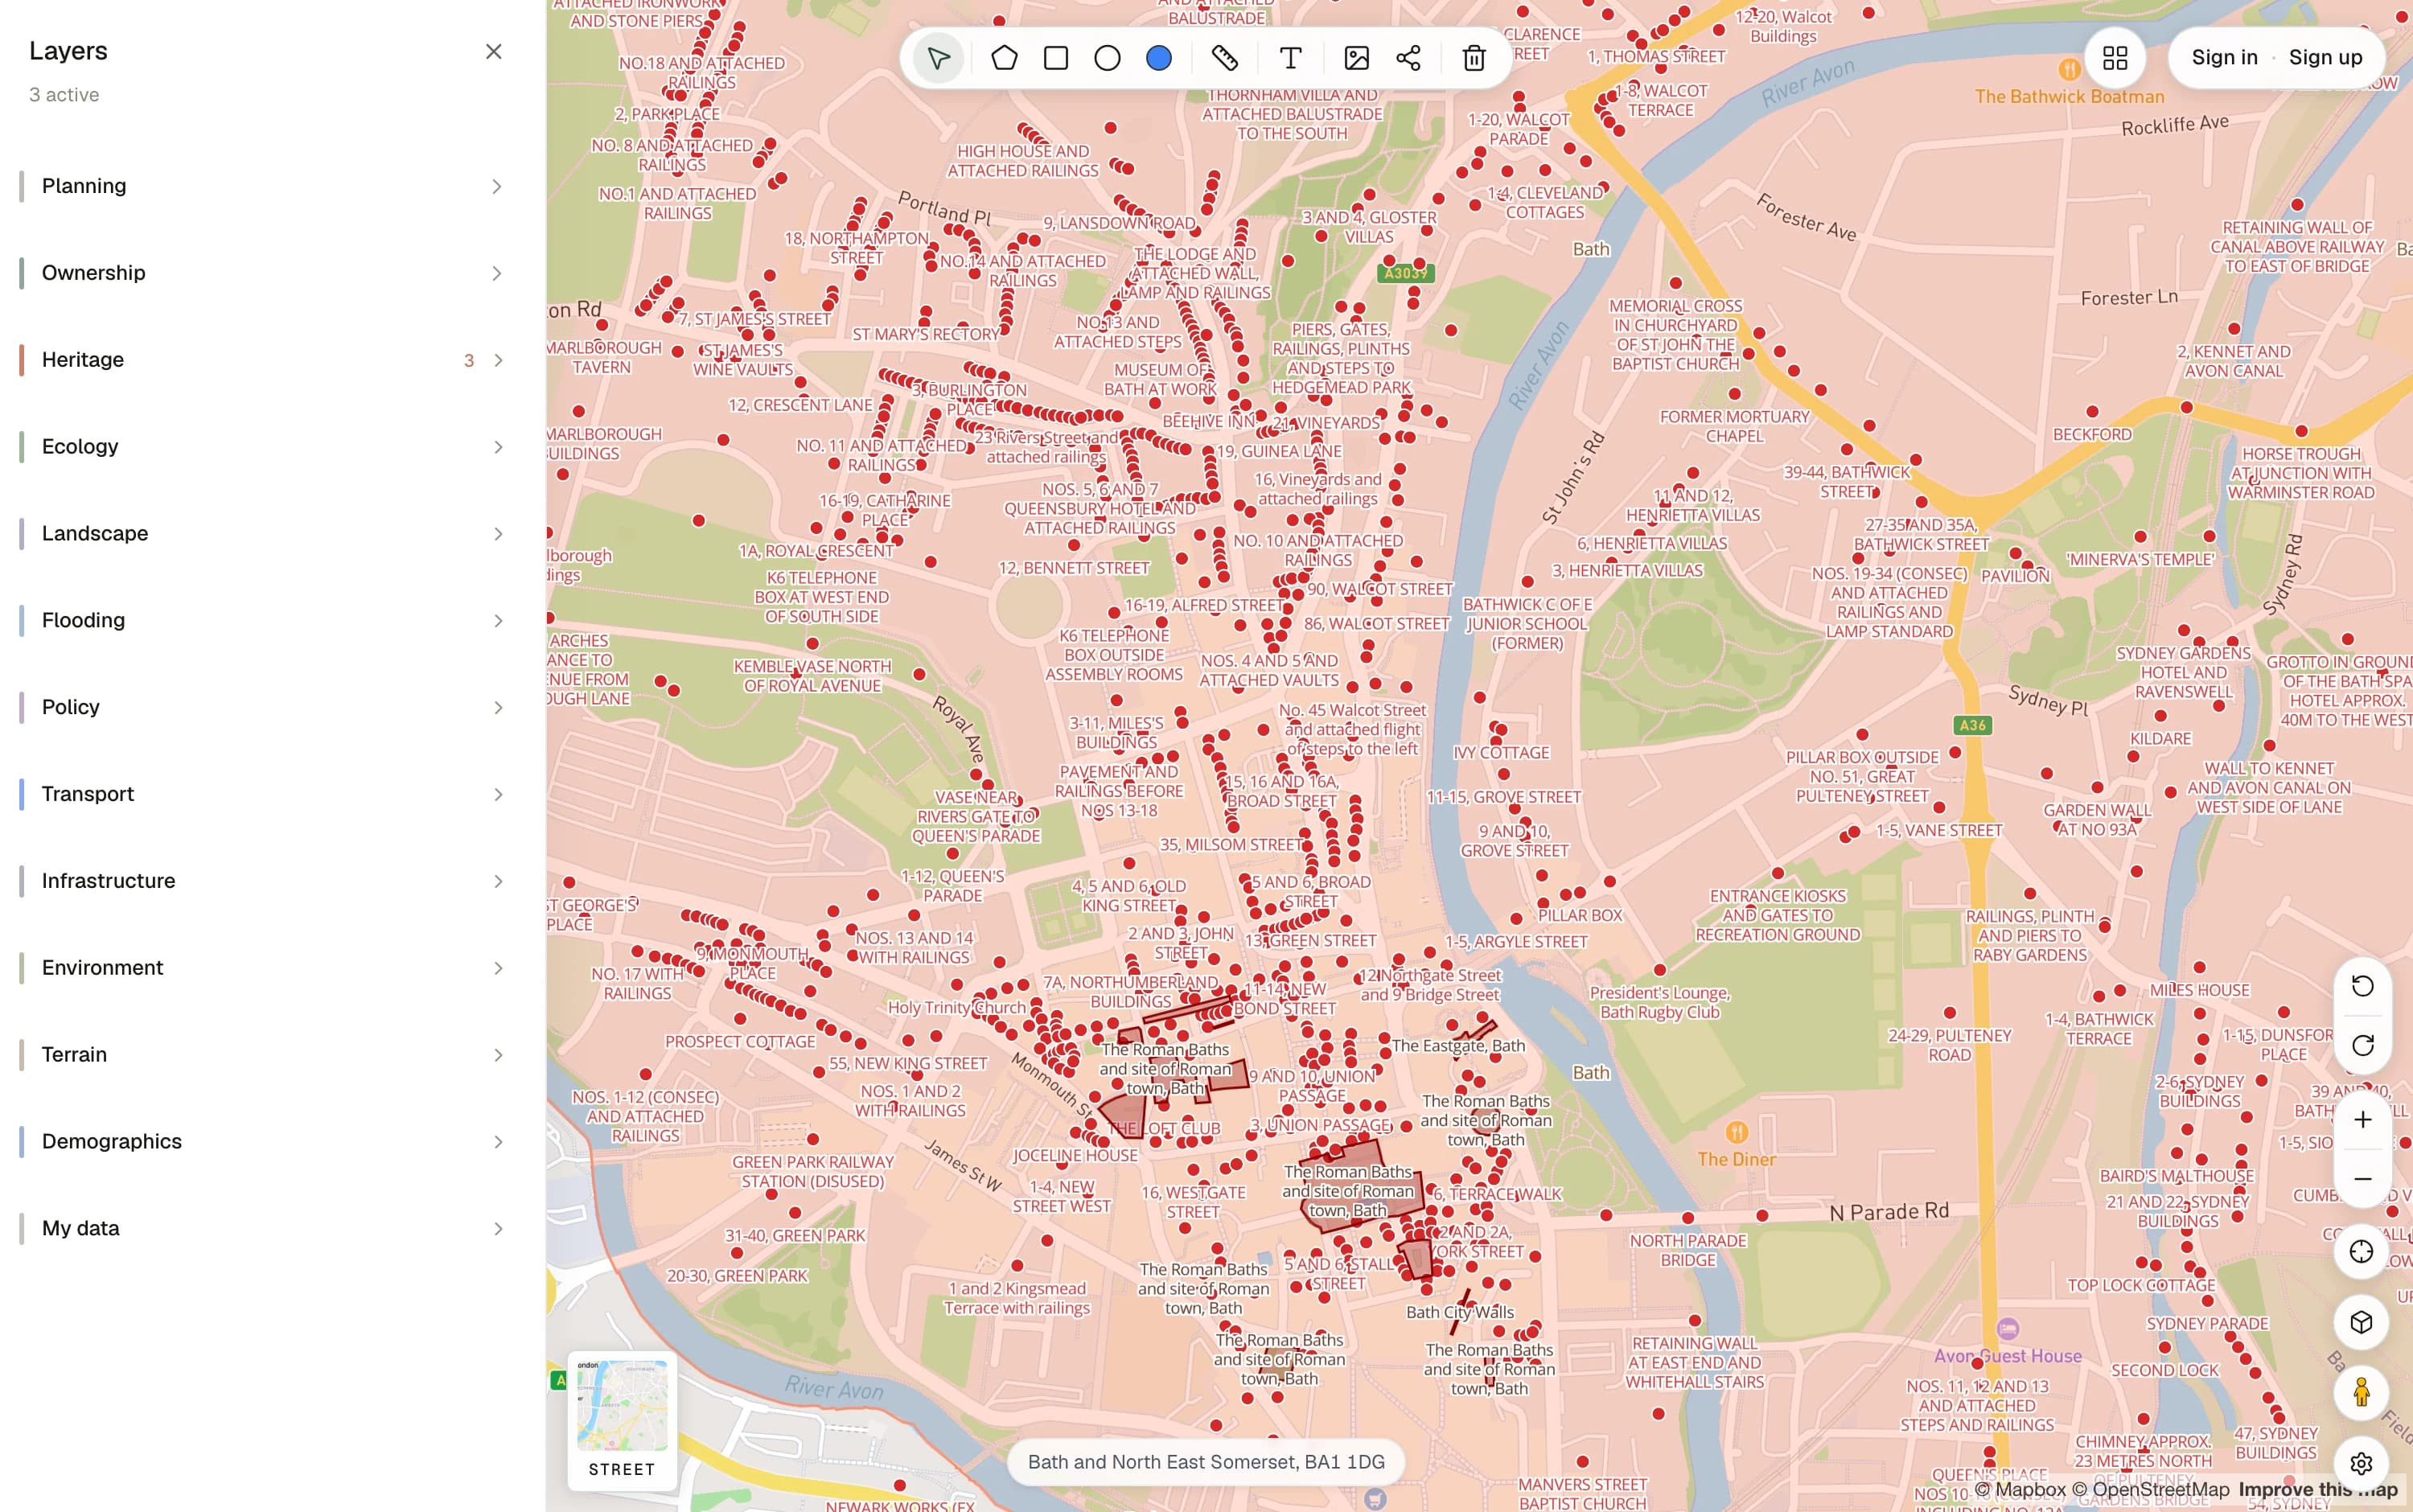
Bath city centre with the heritage group switched on: every listed building and the conservation area boundary, over the street basemap.
A sample
Five of the eighty-eight.
Each one is drawn from the body that publishes it, refreshed on its own schedule, and named on the data page so you can go and check it. Every capture below is the bare map at one scale and one frame, at the zoom where that layer actually reads.
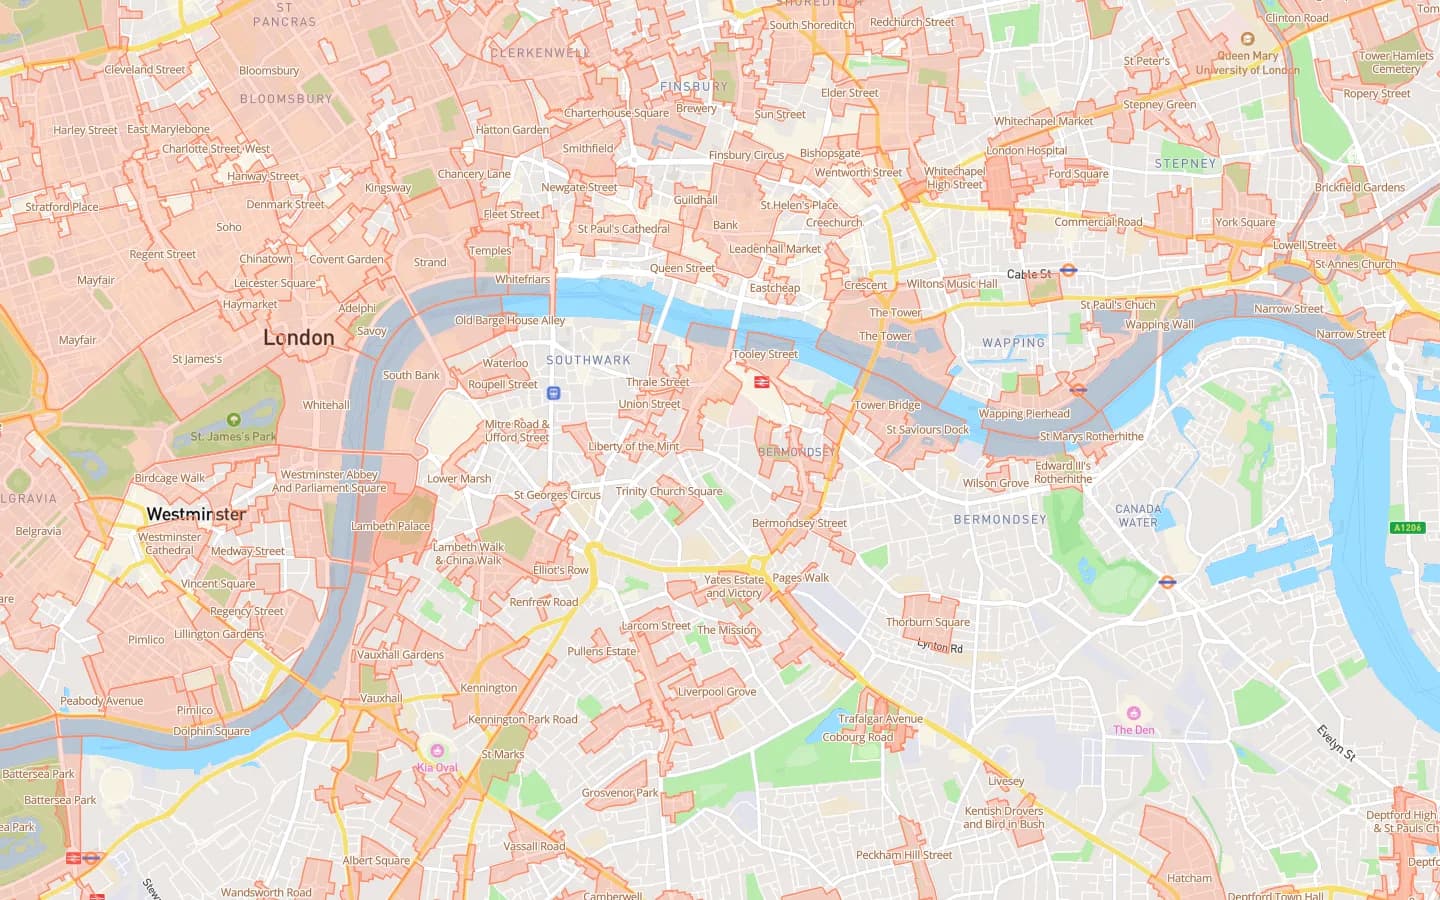
Conservation areas
Southwark and Bermondseyplanning.data.gov.uk
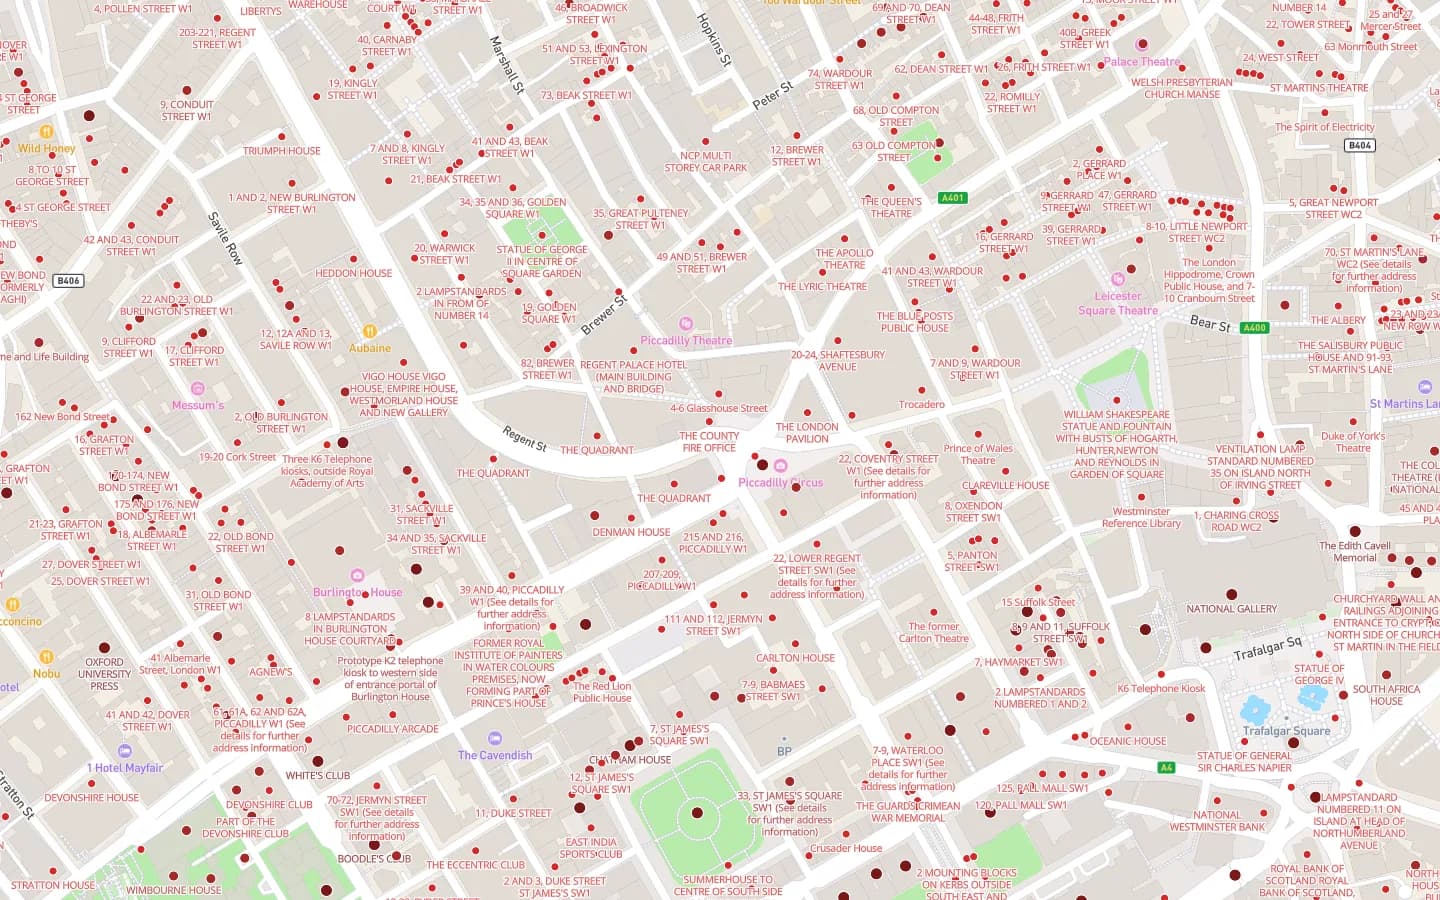
Listed buildings
MayfairHistoric England
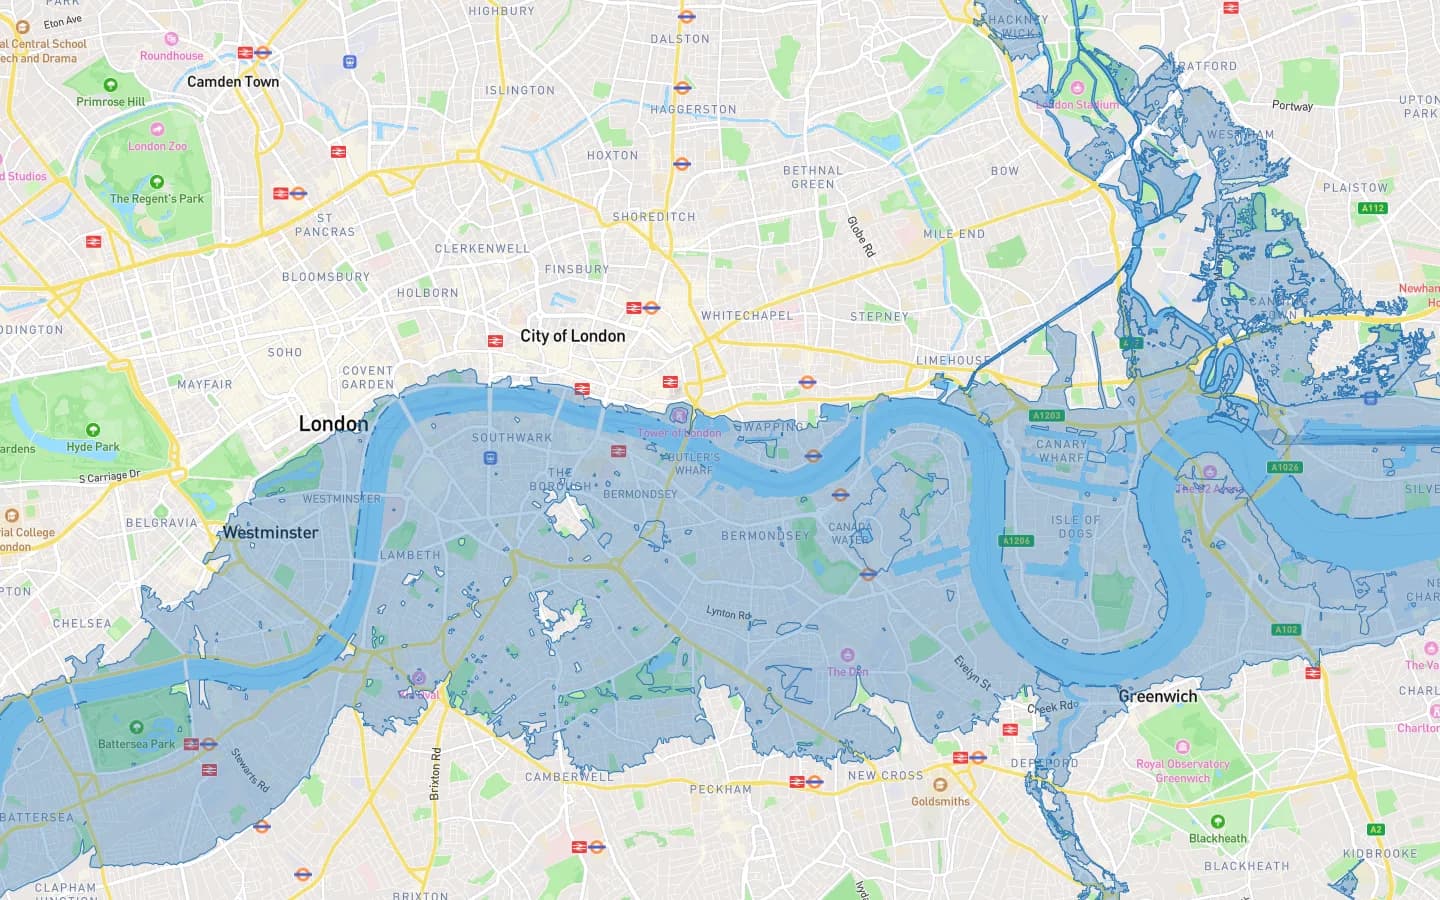
Flood zone 3
The tidal ThamesEnvironment Agency
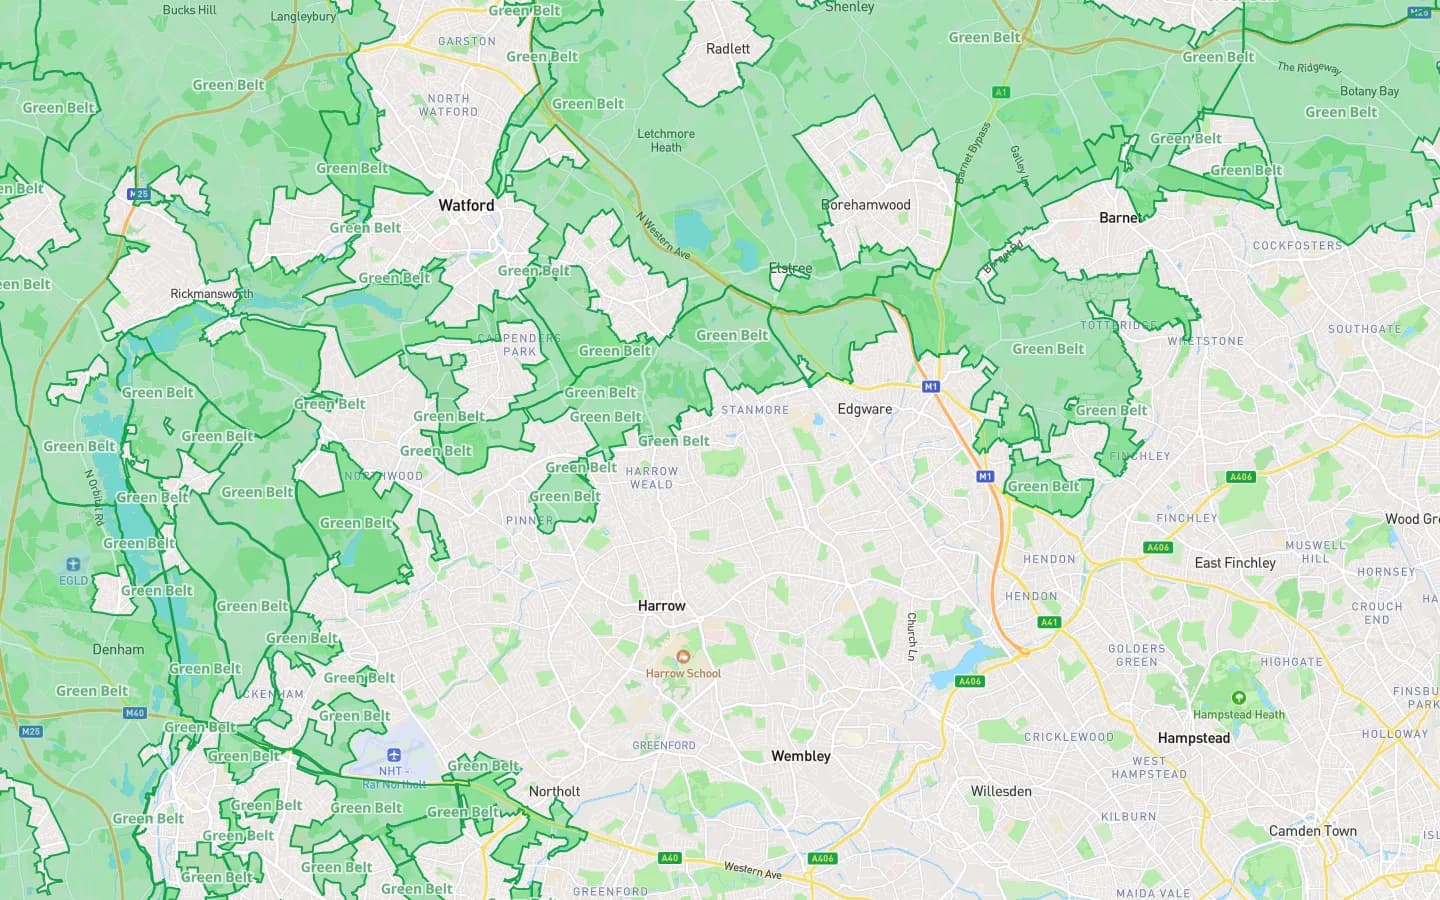
Green belt
The north-west London fringeplanning.data.gov.uk
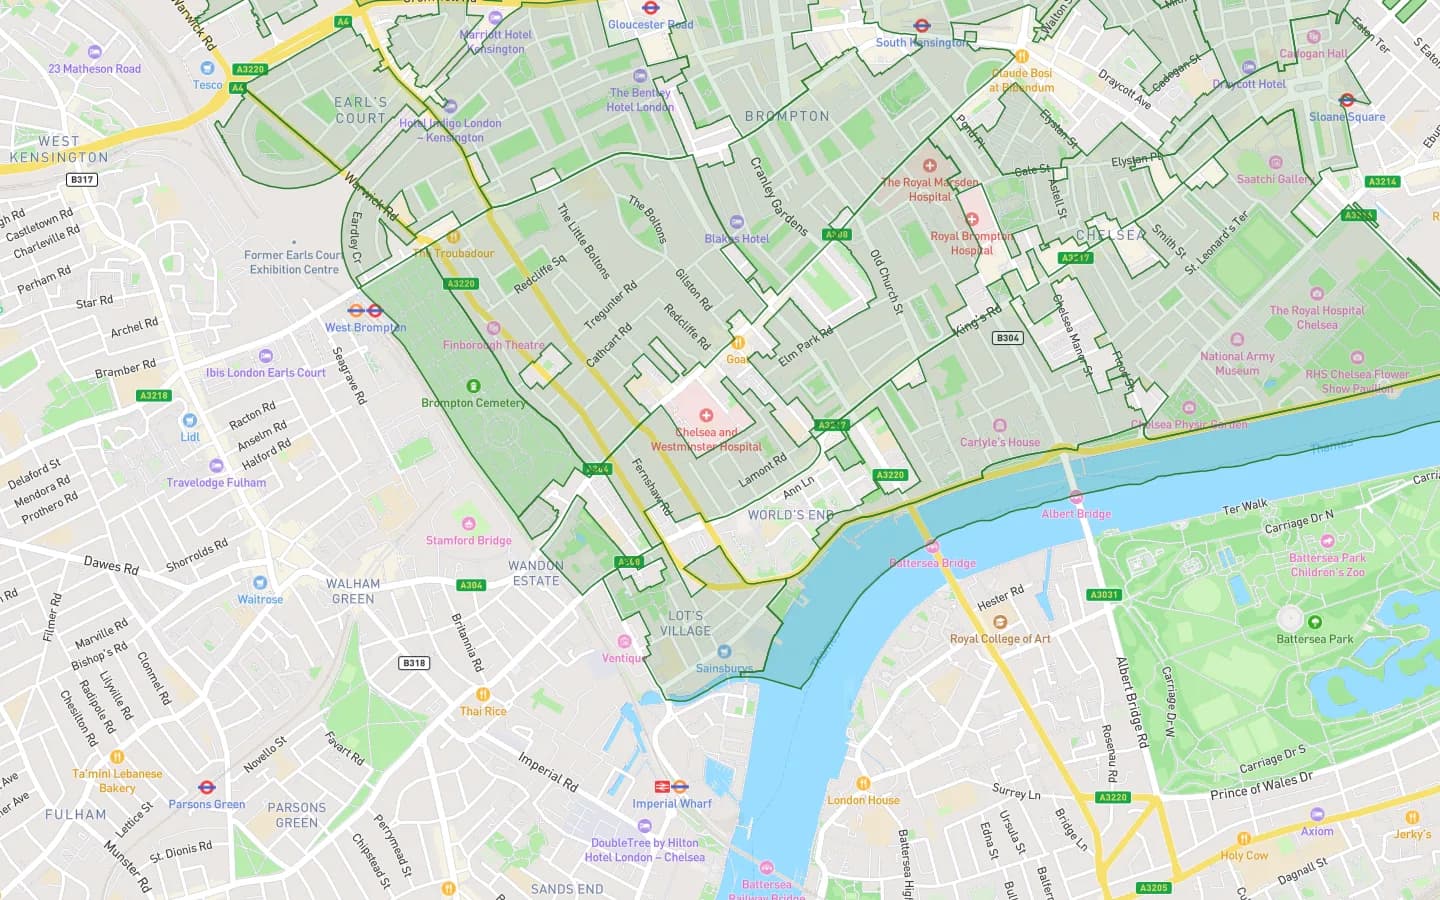
Tree preservation orders
Kensingtonplanning.data.gov.uk
- 83more, each with its source namedAll 88 sources
Drawing
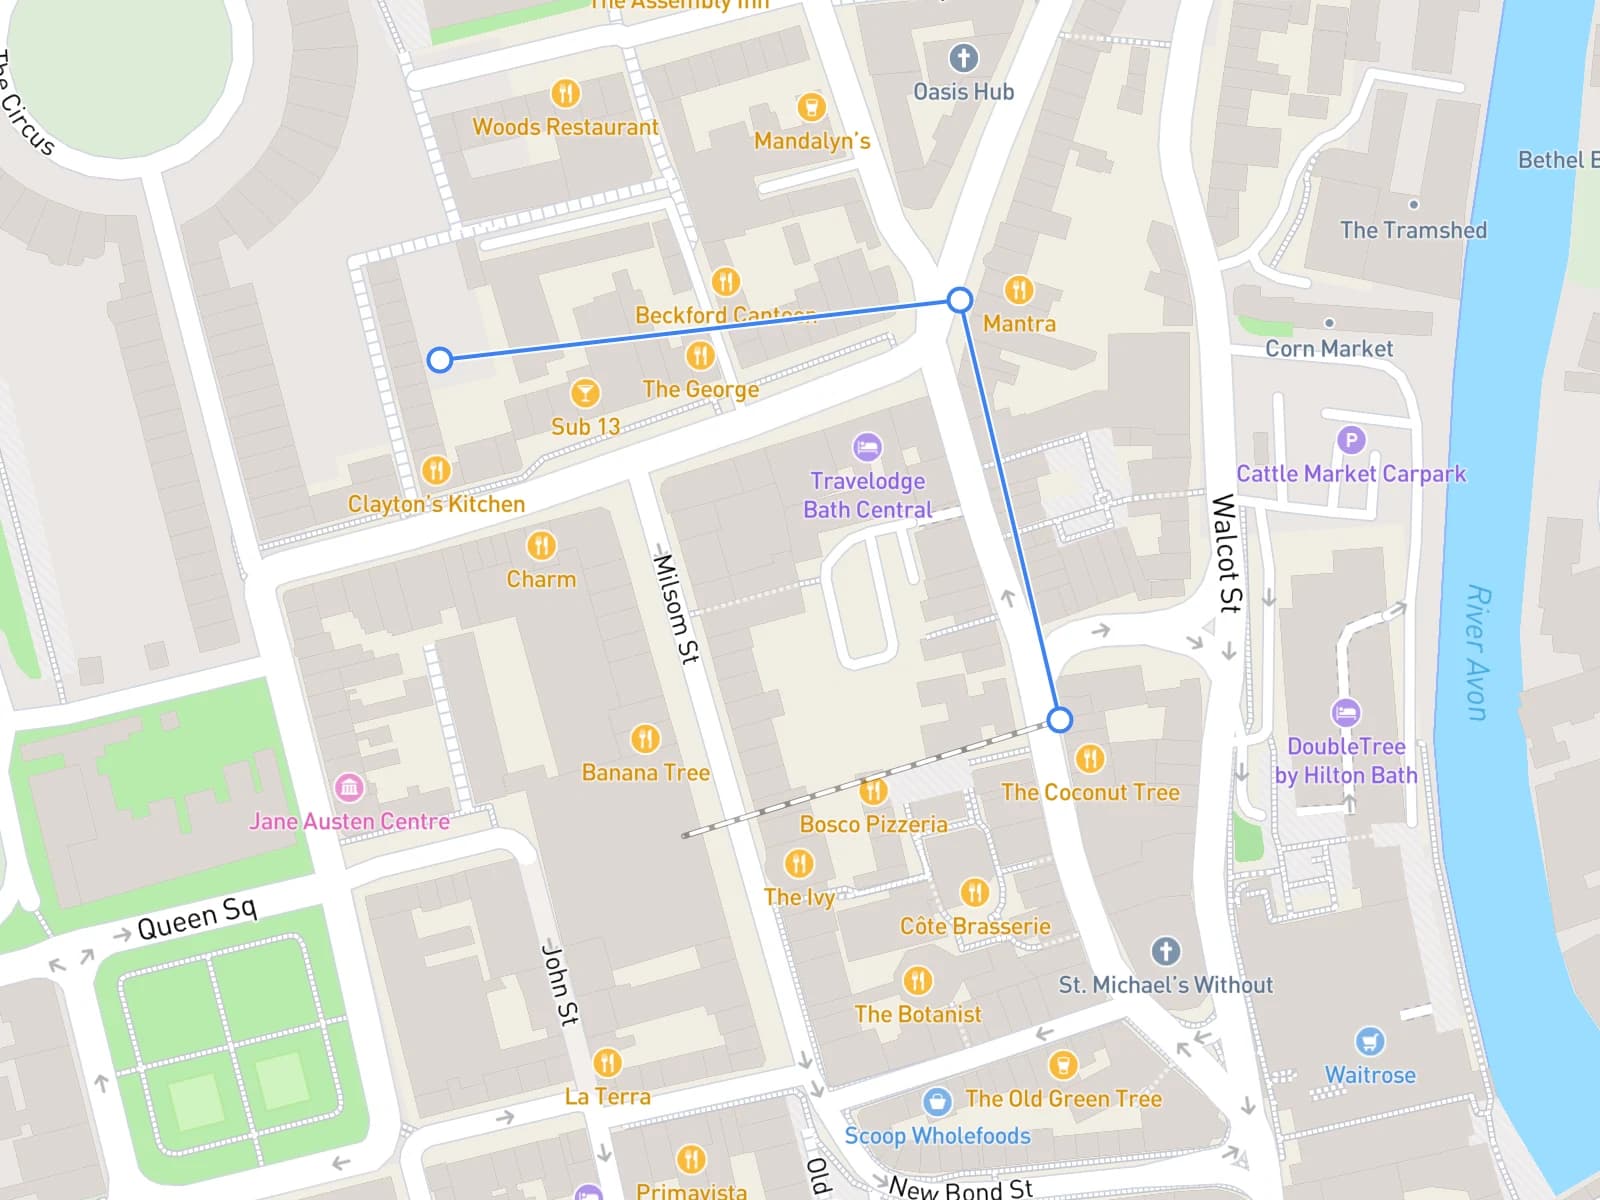
Draw the red line yourself.
A polygon, a rectangle, or a circle at a radius you set. Snap it to a boundary, measure an edge, and the area is computed as you draw. That red line is the input to everything else Wren does.
Nothing you draw is public and nothing needs an account to try.
| What it is | Elsewhere | Wren |
|---|---|---|
| Constraint layers over a site | £150 to £700 a month | Free |
| Ownership and title extracts | Metered per search | Free to view |
| Council policy and levy data | Enterprise tier | Free |
| Drawing and measuring | Paid seat | Free |
Search an address. That is the whole first step.
No account, no card, no trial limit, and nothing you draw is published anywhere.